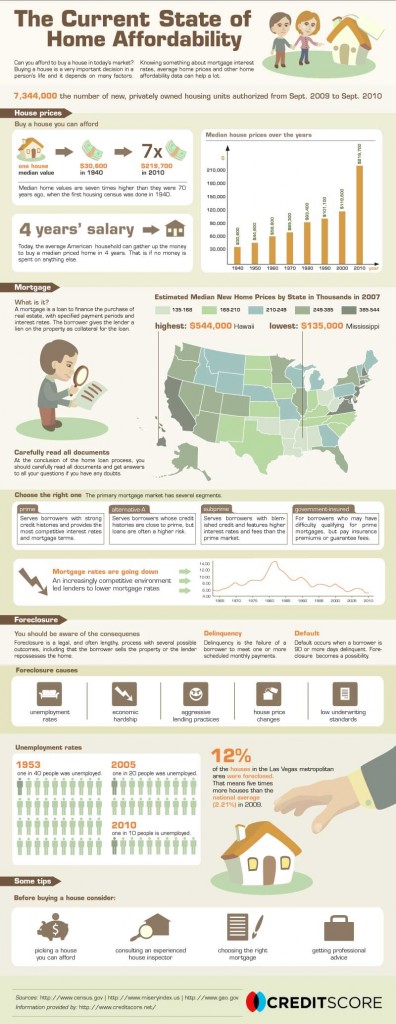
If you’re bored silly of writing long text entries and endless statistics for your real estate blog or website, Â inject some creativity to your marketing and create an Infographic.
Infographics are simple, graphic representations of information or data, used to present complex info quickly and clearly.
Take a look at this real estate infographic sample on Home Affordability from CreditScore.
- Unless your prospects have the time of day, Â they probably won’t read the long text content on your site’s Buyer/Seller resource page.
- Infographics segregate data into bite-sized chunks, accompanied by colorful graphics such as charts, diagrams, and illustrations.
- This allows you to understand and retain the statistics presented, making your prospects more informed, whether they are looking to buy or sell a property.
2. Accessible online and offline
- Since it’s published as an image, it can be easily saved on a laptop or mobile device even for offline use and can also be printed and distributed manually.
3. Viral
- Infographics contribute a lot in terms of company branding and promotion and they look so appealing that thay are instantly shareable.
- A link to your website at the end of the infographic makes sure that people find their way back to your website.
4. Budget-friendly
- When effectively distributed, Infographics have the potential to reach your market not unlike a paid ad but with less cost. With the right design and content, you can come up with a great Infographic that can be disseminated through various platforms. Visual.ly is now looking into developing a platform where marketers can automatically have an infographic created and showcased.
Visual information is powerful, but requires a bit of work to create. You can ask a graphic designer to help you make sure that you’re effectively getting your message across.
Follow us on Twitter and Facebook for more real estate marketing tips!
